Anaheim Ducks Attendance Predictions
Machine learning forecasting project completed at OC Sports & Entertainment, focused on predicting game-level attendance for Anaheim Ducks home games in order to improve operational planning, staffing, and marketing effectiveness.
Project Snapshot
- Organization: OC Sports & Entertainment
- Context: Sports analytics / ticket demand forecasting
- Dataset: 4 seasons of historical ticketing and game-level data
- Scale: 41 home games per season, 12,000+ average attendance
- Capacity: ~16,000 seats
- Problem Type: Regression / attendance forecasting
- Target: Total attendance as a percentage of arena capacity
- Models: XGBoost, Random Forest, ARIMA, LSTM, Elastic Net, KNN
- Tools: Python, pandas, scikit-learn, XGBoost, time series modeling
Overview
This project was designed to help forecast demand for Anaheim Ducks home games at the game level. The broader goal was to give business and operations teams better visibility into expected attendance ahead of each event so they could make more informed decisions around staffing, promotions, and fan engagement strategy.
To build the system, I aggregated and cleaned large-scale historical ticketing data from the previous four seasons and combined it with a wide set of contextual features that influence fan demand. These included opponent, day of week, season timing, promotions, weather, holiday effects, schedule density, team performance, giveaways, tickets sold, and historical purchasing behavior.
What I Worked On
- Aggregated and cleaned multi-season historical ticketing data
- Built game-level features capturing timing, promotions, and contextual demand drivers
- Engineered variables to represent temporal trends and fan purchasing behavior
- Trained and compared multiple forecasting and machine learning models
- Evaluated model stability and predictive accuracy across game contexts
- Integrated forecasts into internal analytics workflows and dashboards
Technical Approach
The project began with assembling a structured game-level modeling dataset from several seasons of historical records. Because demand was shaped by both business and behavioral factors, the modeling pipeline emphasized careful preprocessing and feature engineering rather than relying only on model complexity.
The feature engineering process included:
- Temporal features such as month, season timing, and day-of-week patterns
- Opponent and matchup context
- Promotion and giveaway indicators
- Weather and holiday effects
- Schedule density and rest-related variables
- Team performance and momentum signals
- Historical fan purchasing behavior and demand trend features
I trained and evaluated several candidate models, including XGBoost, Random Forest, ARIMA, LSTM, Elastic Net, and KNN. After comparing predictive performance and consistency, XGBoost was selected as the final model because it provided the best balance of accuracy, robustness, and stability across different attendance scenarios.
Results
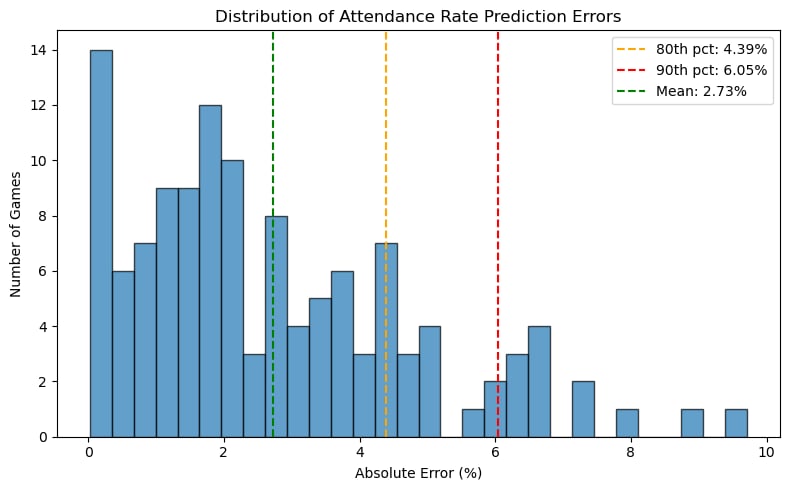
The final XGBoost model predicted total attendance as a percentage of arena capacity with approximately 2.7% mean absolute error, meaning forecasts were typically within a few percentage points of actual attendance.
That level of accuracy made the model useful in practice, especially for identifying how attendance expectations changed across different game contexts such as weekend matchups, promotional nights, holidays, and periods of stronger or weaker team performance.
Business Impact
The forecasting outputs were integrated into internal analytics workflows and dashboards, allowing teams to plan earlier and make more informed decisions. These forecasts helped support operational preparation, improve staffing alignment, optimize promotional timing, and strengthen targeting strategies by highlighting variability in expected fan demand.
More broadly, the project demonstrated how predictive modeling can create value in a sports business setting by connecting historical fan behavior with forward-looking decisions that affect both the game-day experience and commercial performance.
Key Takeaways
- High-quality feature engineering was essential for capturing attendance demand signals
- XGBoost outperformed a diverse set of statistical, ML, and deep learning models
- Game attendance is driven by a mix of temporal, behavioral, and promotional factors
- Forecasting models can directly improve planning, staffing, and marketing strategy in live sports environments