Parking Analytics Infrastructure
Built a real-time parking analytics pipeline and leadership dashboarding system to track garage flow, utilization, and event-day vehicle movement at scale.
Project Snapshot
- Context: Live event operations / parking analytics
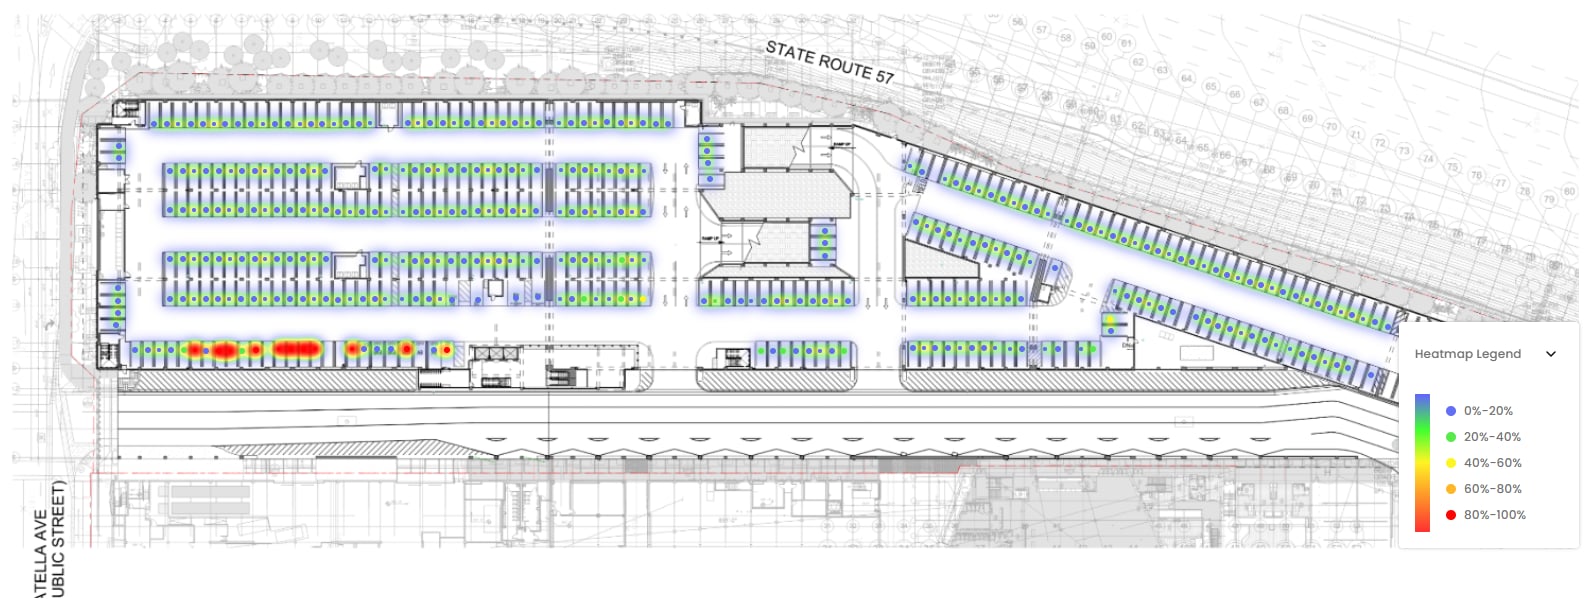
- Scale: 4,500+ parking bays across 6 floors and 24 zones
- Infrastructure: 20+ entrances and exits, with cameras at each entrance, exit, and parking bay
- Volume: 4,000+ cars per event across roughly 100 events per year
- Stack: Python, APIs, SQL, Jenkins, GitHub, Power BI
Overview
This project started with a new parking structure equipped with camera-based monitoring at every entrance, exit, and parking bay. I helped build the data infrastructure needed to turn those raw camera events into something operationally useful.
The core challenge was not just collecting the data, but stitching together a full vehicle journey: when a car entered the structure, where it parked, when it left its spot, and when it ultimately exited the building. That required automated ingestion, cleaning, entity matching, and transformation logic that could support both historical analysis and live dashboards.
What I Built
- Automated ingestion of parking camera data through external APIs
- Database loading workflows for high-volume event-day parking data
- Python transformation logic to clean and standardize camera event streams
- License plate-based joins to connect entry, parking bay, stall departure, and garage exit events
- A daily scheduled pipeline in GitHub/Jenkins to refresh the joined vehicle-lifecycle table
- Power BI reporting for leadership and parking operations teams
Technical Approach
Each event generated a constant stream of records from multiple camera sources. I worked on ingesting those feeds through APIs and loading them into our database quickly enough to support live operational reporting. From there, I transformed the data into a cleaner event-level table by matching camera records using license plate information.
That join logic made it possible to reconstruct a vehicle lifecycle across disconnected systems: entry into the structure, parking activity within a bay, departure from the bay, and final exit. I then saved that transformed table and automated the refresh process so it could run daily through Jenkins using scripts stored in GitHub.
Dashboards & KPIs
On top of the pipeline, I built Power BI dashboards that gave leadership visibility into parking operations in a way they had never had before. Instead of just seeing counts, they could monitor flow, speed, utilization, and post-event clearing behavior.
- Average time to park during an event
- Average time to leave after an event
- Total time to empty the garage
- Total bays used
- Total cars per event
- Utilization patterns by floor and zone
- Ingress and egress timing trends
Business Impact
The biggest impact of the project was that it created a new foundation for operational decision-making. The parking team could now use live and historical data to better understand how traffic moved through the structure and where bottlenecks emerged.
That also opened the door to experimentation and A/B testing. For example, we could start testing different traffic flow patterns by event type, vary which entrances and exits were used, and route vehicles differently depending on projected attendance, expected vehicle volume, and the number of parking zones we wanted to activate. In other words, the project shifted parking from reactive management to a more measurable and optimizable operation.
Why This Project Matters
This project is a good example of the type of work I enjoy most: taking messy, high-volume operational data and turning it into something reliable, scalable, and decision-ready. It combined engineering, analytics, and business understanding in one workflow — from APIs and automation to KPI design and real-time reporting.
Key Takeaways
- Built infrastructure that connected raw camera events into a usable vehicle lifecycle dataset
- Automated ingestion and transformation pipelines for ongoing reporting
- Delivered live dashboards that improved visibility for parking operations and leadership
- Enabled future testing and optimization of ingress/egress strategies at event scale