Single Game Ticket Forecasting for Anaheim Ducks Games
Predictive modeling project completed at OC Sports & Entertainment, focused on estimating the number of single game ticket buyers for each Anaheim Ducks home game to improve marketing strategy, promotional planning, and revenue forecasting.
Project Snapshot
- Organization: OC Sports & Entertainment
- Context: Sports analytics / ticket sales forecasting
- Dataset: 7 seasons of Anaheim Ducks home game sales data
- Scale: 287 games, each with 120 days of pregame sales activity
- Data Size: 34,000+ daily sales records with 60+ engineered features
- Problem Type: Supervised regression
- Target: Number of single game ticket buyers per home game
- Models: XGBoost, Random Forest, Elastic Net, KNN, LSTM, ARIMA
- Tools: Python, pandas, scikit-learn, XGBoost, time series validation
Overview
This project was built to forecast how many single game ticket buyers would ultimately purchase for each Anaheim Ducks home game. In a sports business setting, that forecast is highly valuable because single game buyers are one of the most responsive audience segments for targeted marketing, promotions, and short-term ticket sales strategy.
To support that goal, I developed a predictive modeling pipeline that combined historical ticketing behavior, game context, pricing, and daily sales ramp-up information. The final system helped internal teams better anticipate demand variability across games and make more informed decisions about campaign timing, promotional planning, and revenue expectations.
What I Worked On
- Aggregated and cleaned large-scale multi-season ticketing data
- Built a game-by-day dataset covering 120 days of sales leading up to each home game
- Engineered 60+ features capturing buyer behavior, demand trends, and game context
- Designed realistic forward-looking validation to avoid leakage
- Simulated live backtesting across seasons using sequential training and prediction
- Trained and compared multiple statistical, machine learning, and deep learning models
- Integrated outputs into internal analytics workflows for stakeholder use
Technical Approach
The core challenge was that ticket demand evolves over time. For each game, there were 120 days of sales activity leading up to puck drop, so the model needed to learn not only which games were likely to perform well, but also how buyer demand ramped up over time. I structured the data to reflect that sequential sales process and created a modeling dataset spanning 7 seasons, 287 home games, and more than 34,000 daily observations.
Feature engineering was central to the project. I built variables representing:
- Purchase history and single game buyer behavior
- Ticket type trends and differences between single game and non-single game buyers
- Historical game demand and recent sales ramp-up patterns
- Opponent strength and team rank context
- Day-of-week, seasonality, and other timing effects
- Promotional context and game-specific marketing factors
- Primary market sales and secondary market sales signals
- Ticket price levels and section-level capacity information
I evaluated several modeling approaches, including Random Forest, Elastic Net, KNN, LSTM, and ARIMA. XGBoost was ultimately selected as the primary model because it performed best on the tabular feature set, captured nonlinear demand relationships well, trained much faster than LSTM-based alternatives, and was less prone to overfitting.
To make the evaluation realistic, I used simulated live backtesting across seasons, training only on information that would have been available at the time of prediction. This ensured the model reflected a true forward-looking deployment scenario rather than benefiting from future leakage.
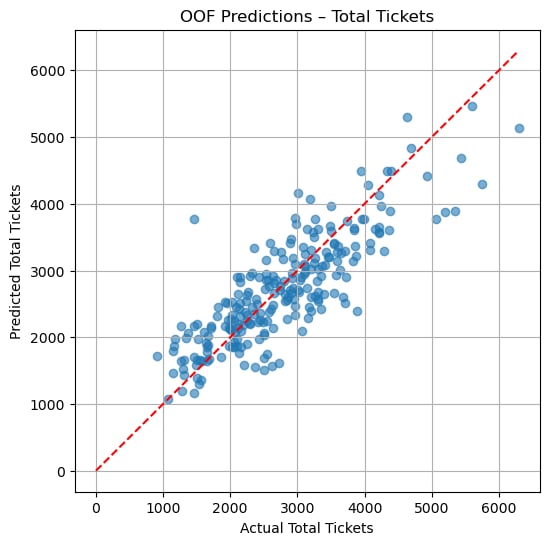
Results
The final model achieved approximately 400 mean absolute error on an average of roughly 3,000 single game buyers per game, corresponding to about 13% relative error.
Given the variability of sports ticket demand across opponents, promotions, season timing, and team performance, that level of accuracy was strong enough to make the model useful for planning and business decision-making. It provided a more structured and data-driven view of expected single game buyer demand well before each game date.
Why It Matters
This project translated ticketing data into actionable forecasting insights for business stakeholders. By predicting the number of single game buyers in advance, the model helped teams think more strategically about when to launch campaigns, how aggressively to market specific games, and where demand variability was likely to create revenue opportunities or risks.
The outputs were integrated into internal analytics workflows and supported decisions around marketing timing, audience targeting, promotional planning, and broader ticket sales strategy. More broadly, the project showed how predictive modeling can support revenue operations in live sports by combining behavioral data, pricing signals, and game context into a practical forecasting tool.
Key Takeaways
- Sequential sales data can be turned into a strong supervised forecasting problem with the right structure
- Feature engineering around ramp-up trends, buyer behavior, and game context was critical to performance
- XGBoost provided the best balance of predictive power, speed, and robustness
- Realistic backtesting and leakage prevention were essential for trustworthy model evaluation
- Forecasting single game buyers can directly improve marketing and ticket sales decision-making